Semiconductor Capacitance Extraction & Linearization Tool
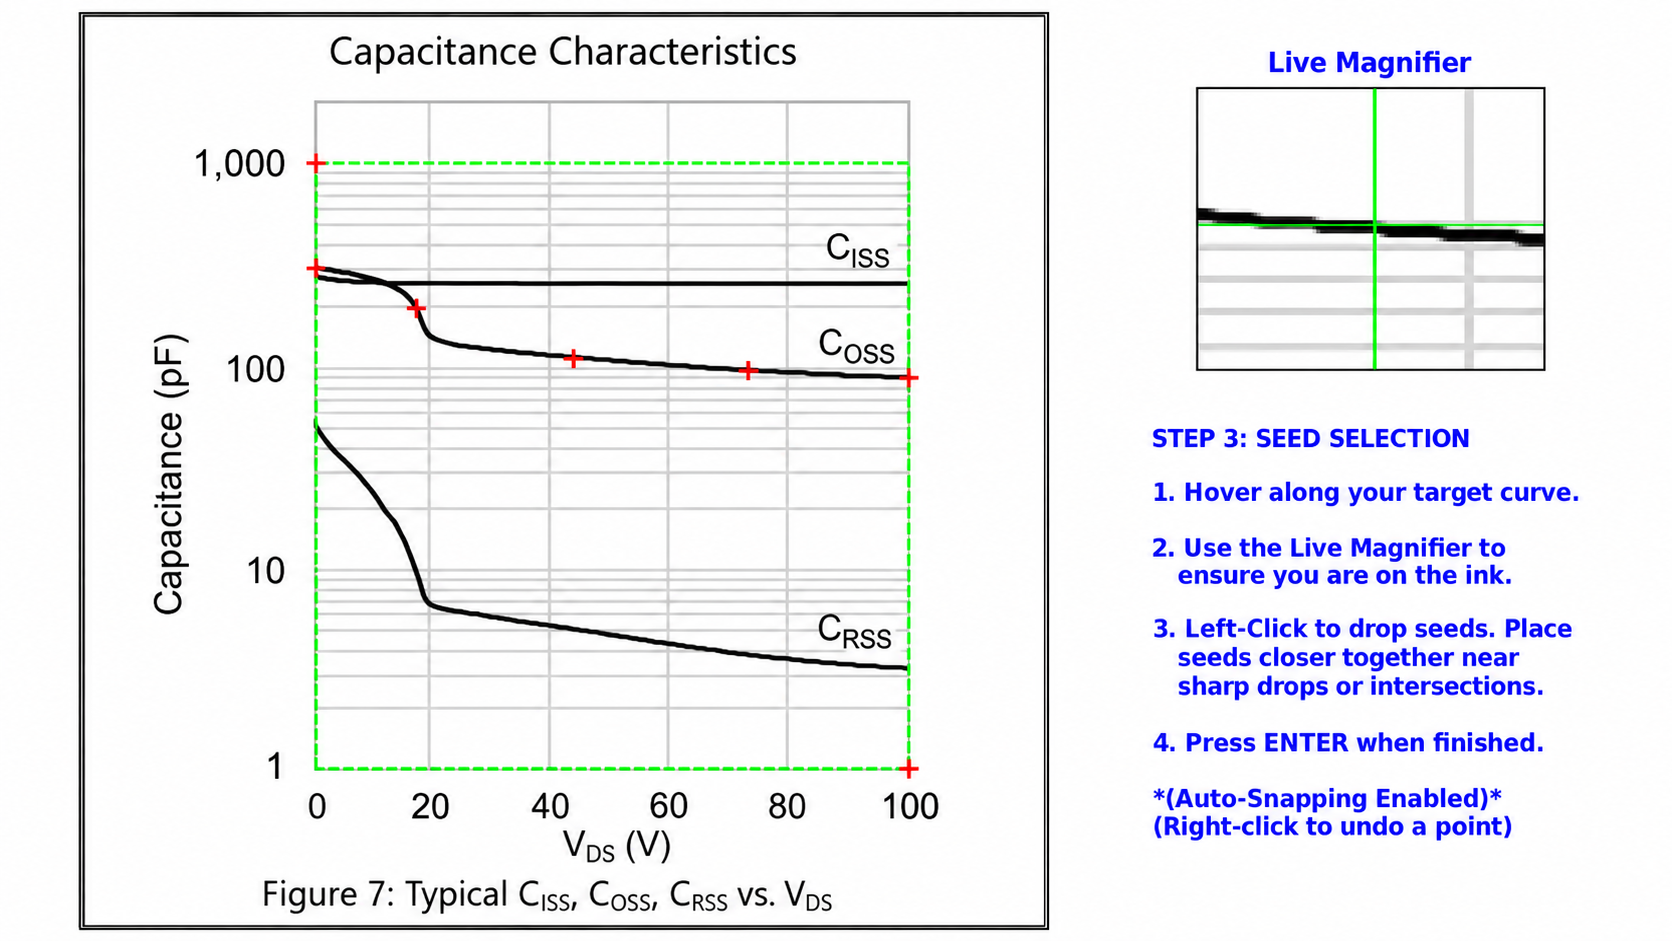
Image 1: Interactive Axis Calibration and Seed Selection
Description: The user defines the graph boundaries and places seed points along the target capacitance curve, assisted by a live magnifier and centroid-based refinement for precise curve selection.
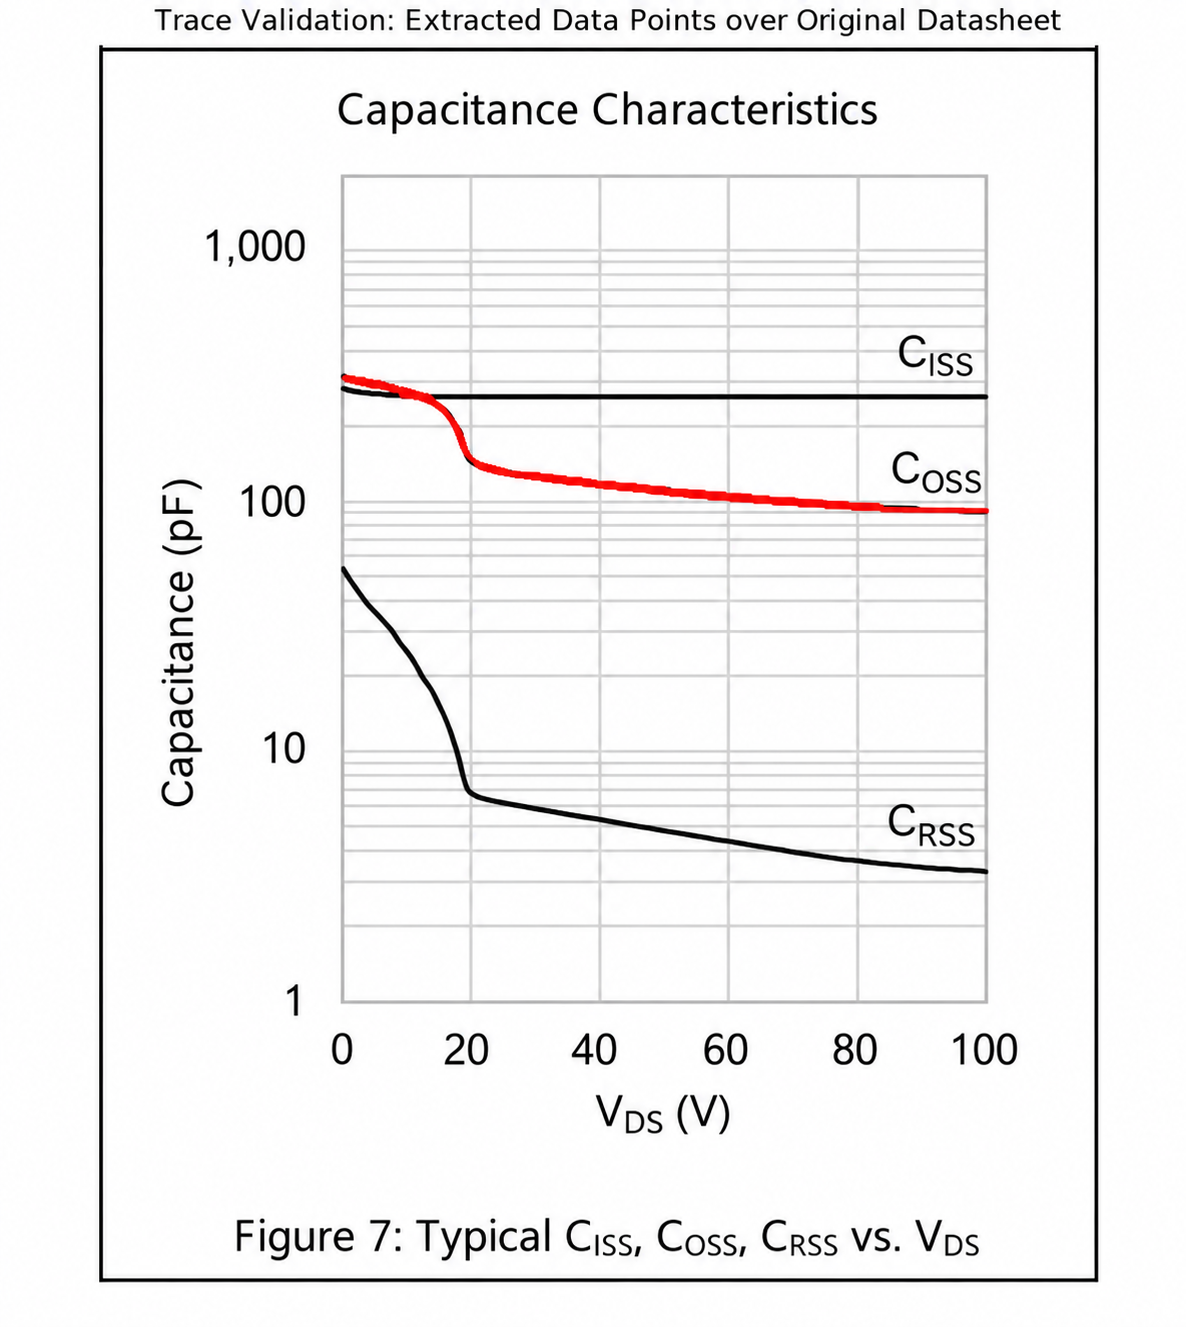
Image 2: Computer-Vision-Assisted Curve Extraction
Description: The extracted Coss path is overlaid on the original datasheet, providing a visual validation that the BFS-based tracing follows the intended capacitance characteristic.
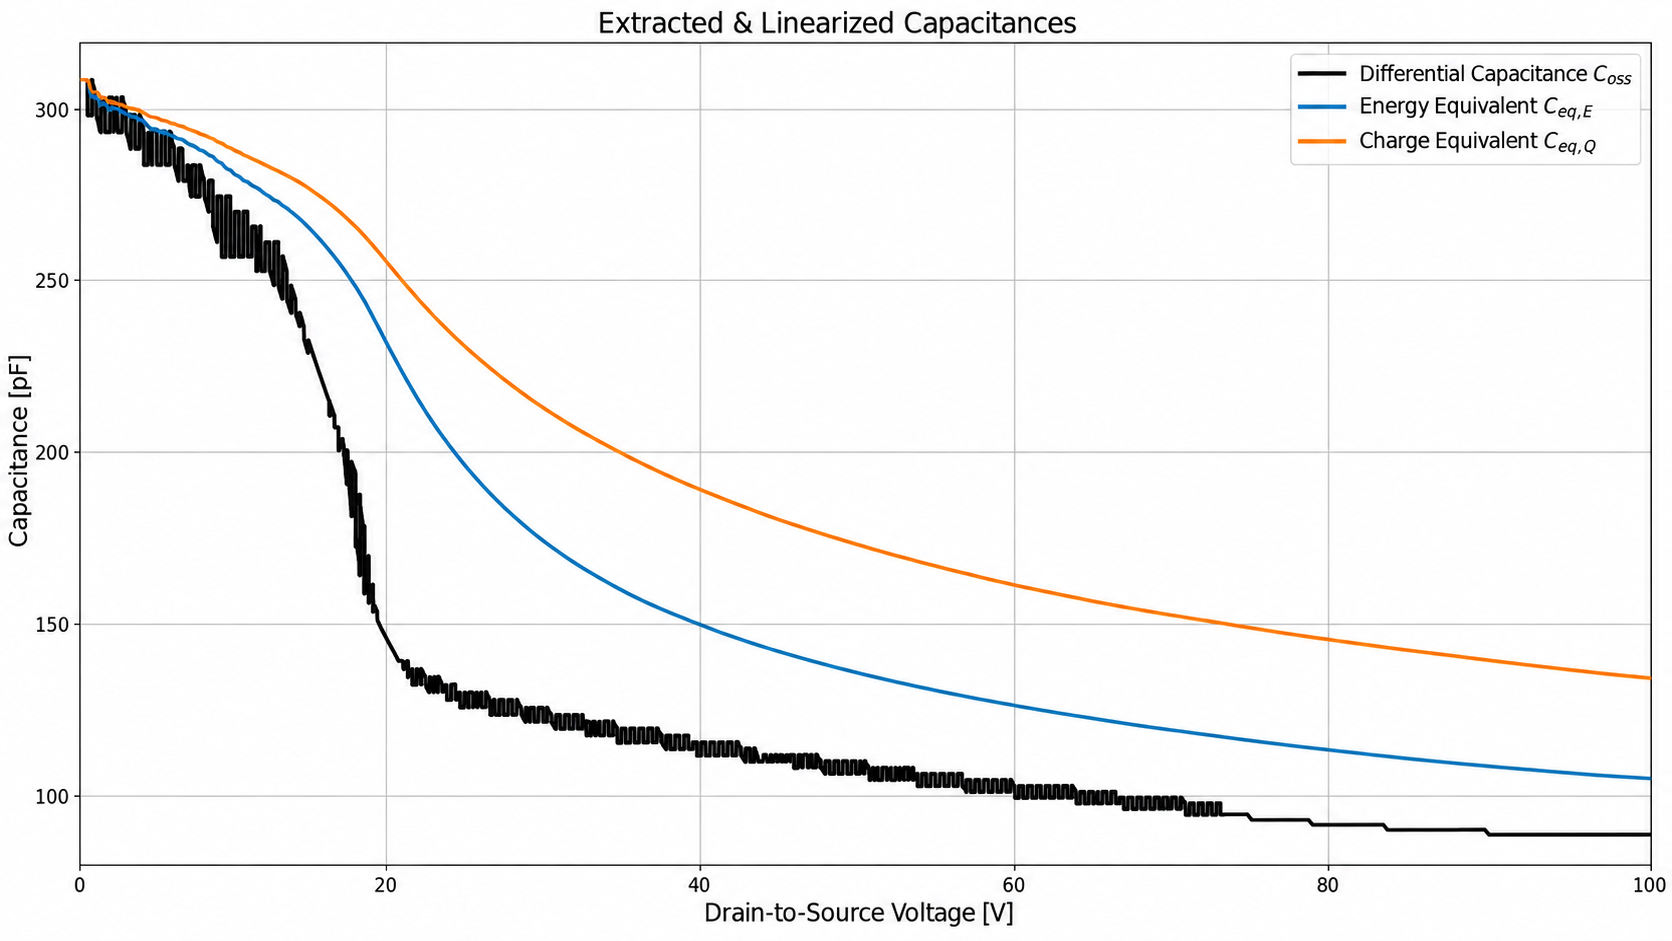
Image 3: Extracted & Linearized Capacitance Curves
Description: The extracted Coss curve is used to calculate the energy-equivalent Ceq,E and charge-equivalent Ceq,Q capacitances. The small zig-zag variations in Coss come from pixel quantization and the finite resolution of the datasheet image, while the equivalent-capacitance curves appear smoother because they are obtained through cumulative numerical integration.
The Semiconductor Capacitance Extraction & Linearization Tool is a Python-based engineering application developed to extract voltage-dependent capacitance characteristics directly from semiconductor datasheet plots. The tool combines interactive graph calibration, computer-vision-assisted curve tracing, coordinate transformation, and numerical analysis into a single workflow.
The extraction process follows a human-in-the-loop approach because datasheet plots can contain overlapping curves, steep nonlinear regions, logarithmic axes, and different plotting conventions. The user defines the graph boundaries and physical axis values, with each axis selectable as linear or logarithmic, and places seed points along the target curve. A live magnifier assists point placement, while each seed is refined using a 3×3 intensity-weighted centroid calculation that gives greater weight to darker curve pixels.
The datasheet image is converted to grayscale and thresholded to create a binary ink mask. Consecutive seed points are connected using an 8-connected Breadth-First Search (BFS), allowing the traced path to follow steep and highly nonlinear sections instead of simply interpolating between selected points. The extracted pixel coordinates are then mapped to physical voltage and capacitance values using the calibrated graph axes.
The extracted Coss(V) data is sorted and cleaned before energy- and charge-equivalent capacitances are calculated through trapezoidal numerical integration. If needed, the first extracted capacitance value is extended to 0 V to define the integration boundary. The raw curve remains unsmoothed, results are exported to CSV, and a trace-validation overlay supports visual verification against the original datasheet.